Over-Permission Analytics
Identifies identities with significantly more access than their organizational peers using statistical outlier detection
Requires role: Operator
Related: Identity Inventory, Risk Posture Dashboard, Select Fire, Stale Identity Detection, Asset Criticality, Attribute Sync Configuration
NOTE
Over-permission findings are now integrated into the Identity Inventory as the "Over-Permissioned" filter preset. The Inventory provides the same peer-group outlier detection within a unified table that includes risk scoring, membership analysis, and delegation posture. This standalone page remains available for fine-grained control over detection sensitivity and peer group size thresholds.
Overview
Over-Permission Analytics automatically detects identities that hold excessive permissions compared to their colleagues in the same role. Instead of relying on fixed permission thresholds, the system groups identities by type, department, and job title, computes a baseline for each peer group, and flags identities that deviate significantly from their peers.
The analysis evaluates effective permissions — not just the permissions directly assigned to an identity, but also permissions inherited through group memberships (up to 5 levels deep). This means nested group misconfigurations (e.g., "Domain Computers" added to "Domain Admins") are surfaced as findings for the affected members.
This is especially useful for identifying:
- Privilege creep — Users who accumulated access across multiple role changes
- Emergency access grants — Temporary elevated permissions that were never revoked
- Misconfigured service accounts — Service accounts with far broader access than necessary
- Nested group misconfigurations — Unexpected group nesting that grants excessive inherited permissions
- Insider risk — High-access identities that may warrant additional monitoring
The analysis runs entirely on live graph data and requires no pre-configuration. Peer groups are formed automatically from directory attributes synced during LDAP or Entra ID synchronization.
NOTE
Over-permission results are pre-computed after each sync and cached per domain. When you open this page with default settings, results load instantly from the cache. Custom filter combinations (non-default sensitivity, type filter, or criticality filter) trigger a live query against the graph database.
How It Works
Identity Scope
The analysis evaluates the following identity types:
- User — Human accounts
- Group — Security and distribution groups
- Computer — Machine accounts
- ServiceAccount — On-premises service accounts
- ServicePrincipal — Entra ID application identities
Groups are analyzed the same way as other identity types — their effective permissions include both direct permission edges (e.g., GenericAll, WriteDacl on other objects) and permissions inherited from parent groups via MemberOf nesting (up to 5 levels). Structural relationships like MemberOf are excluded from permission counting, so Groups are only flagged when they hold genuinely excessive non-structural permissions compared to peer groups. Additionally, group permissions are counted as inherited permissions for the actor identities that are members of those groups.
Peer Group Formation
Identities are always scoped by Domain (security boundary) and Identity Type, then grouped by type-specific attributes that produce the most meaningful comparisons:
| Identity Type | Grouping Attributes | Example Peer Group |
|---|---|---|
| User | Domain + department + title | graphnai.com / User / Engineering / Senior Engineer |
| ServiceAccount | Domain + department + title | graphnai.com / ServiceAccount / IT / Backup |
| Computer | Domain + operating system + isDomainController | graphnai.com / Computer / Windows Server 2022 (DC) |
| AD Group | Domain + group category + group scope + parent container | graphnai.com / Group / Security / Global / OU=IT |
| Entra Group | Domain + classification (Security/M365/Team/Dynamic/Distribution + cloud/hybrid) | contoso.onmicrosoft.com / Group / Security (cloud) |
| ServicePrincipal | Domain + type + assignment required | contoso.onmicrosoft.com / ServicePrincipal / Application / AssignmentRequired |
For example, all Users in dev.lab with department = "Engineering" and title = "Senior Engineer" form a single peer group. All Computers in graphnai.com running Windows Server 2022 that are domain controllers form another. The same grouping attributes in a different domain form separate groups. This ensures identities in unrelated security boundaries are never compared against each other.
NOTE
AD builtin admin groups (Administrators, Domain Admins, Schema Admins, Enterprise Admins, Account Operators, Server Operators, Backup Operators, Print Operators) are automatically excluded from analysis. Their elevated permissions are expected by design and cannot be meaningfully reduced, so including them would skew peer group baselines and generate false positives.
Identities missing grouping attributes are placed in an "Unknown" peer group and still participate in analysis — this helps identify misconfigured or undocumented accounts.
Permission Counting
The system counts effective permissions for each identity: direct permissions plus inherited permissions from group memberships.
Direct permissions — Access relationships directly assigned to the identity:
HasPermission— Explicit resource grantsOwnerOf— Ownership relationshipsHasRole— Role assignments (Entra ID)AppRoleAssignment— Application role assignmentsGenericAll,GenericWrite— Full control and write accessWriteDacl,WriteOwner— Security descriptor modificationAllExtendedRights— Extended attribute rightsForceChangePassword,AddMember— Specific privileges
Inherited permissions — Access relationships held by groups the identity belongs to, traced up to 5 levels of group nesting.
The following relationship types are excluded from counting (they represent structure, not permissions):
MemberOf— Group membership (used for traversal, not counted as a permission)ContainedIn— Organizational structureGPLink— Group Policy linkageTrustedBy— Domain trust relationships
NOTE
Permissions are also severity-weighted using the edge weight from consolidated permission edges. The Risk Weight score reflects this: a GenericAll permission contributes more risk than a ReadProperty permission. The raw permission count treats all permissions equally, while Risk Weight accounts for the severity of each permission type.
Detection Sensitivity
For each peer group, the system computes:
- Average — Average number of effective permissions in the group
- Spread — How much variation exists within the group (technically: standard deviation)
An identity is flagged when its permission count is significantly above the peer group average. The Detection Sensitivity slider controls how far above average an identity must be before it's flagged.
| Sensitivity Level | Description |
|---|---|
| Very High | Flags anyone noticeably above average |
| High | Flags moderate deviations, useful for initial audits |
| Moderate | Balanced detection (recommended for routine use) |
| Low | Only flags significant deviations |
| Very Low | Only flags extreme cases |
Peer Group Size Filter
To ensure statistical reliability, peer groups smaller than the minimum peer group size (default: 3 members) are excluded from analysis. This prevents false positives from tiny groups where variation is expected.
Accessing the Analysis
- Log in as an Operator or Admin
- Navigate to Analysis > Over-Permissions in the sidebar
The analysis runs automatically when you open the page. Results refresh every 5 minutes or when you change filter settings.
Understanding the Summary
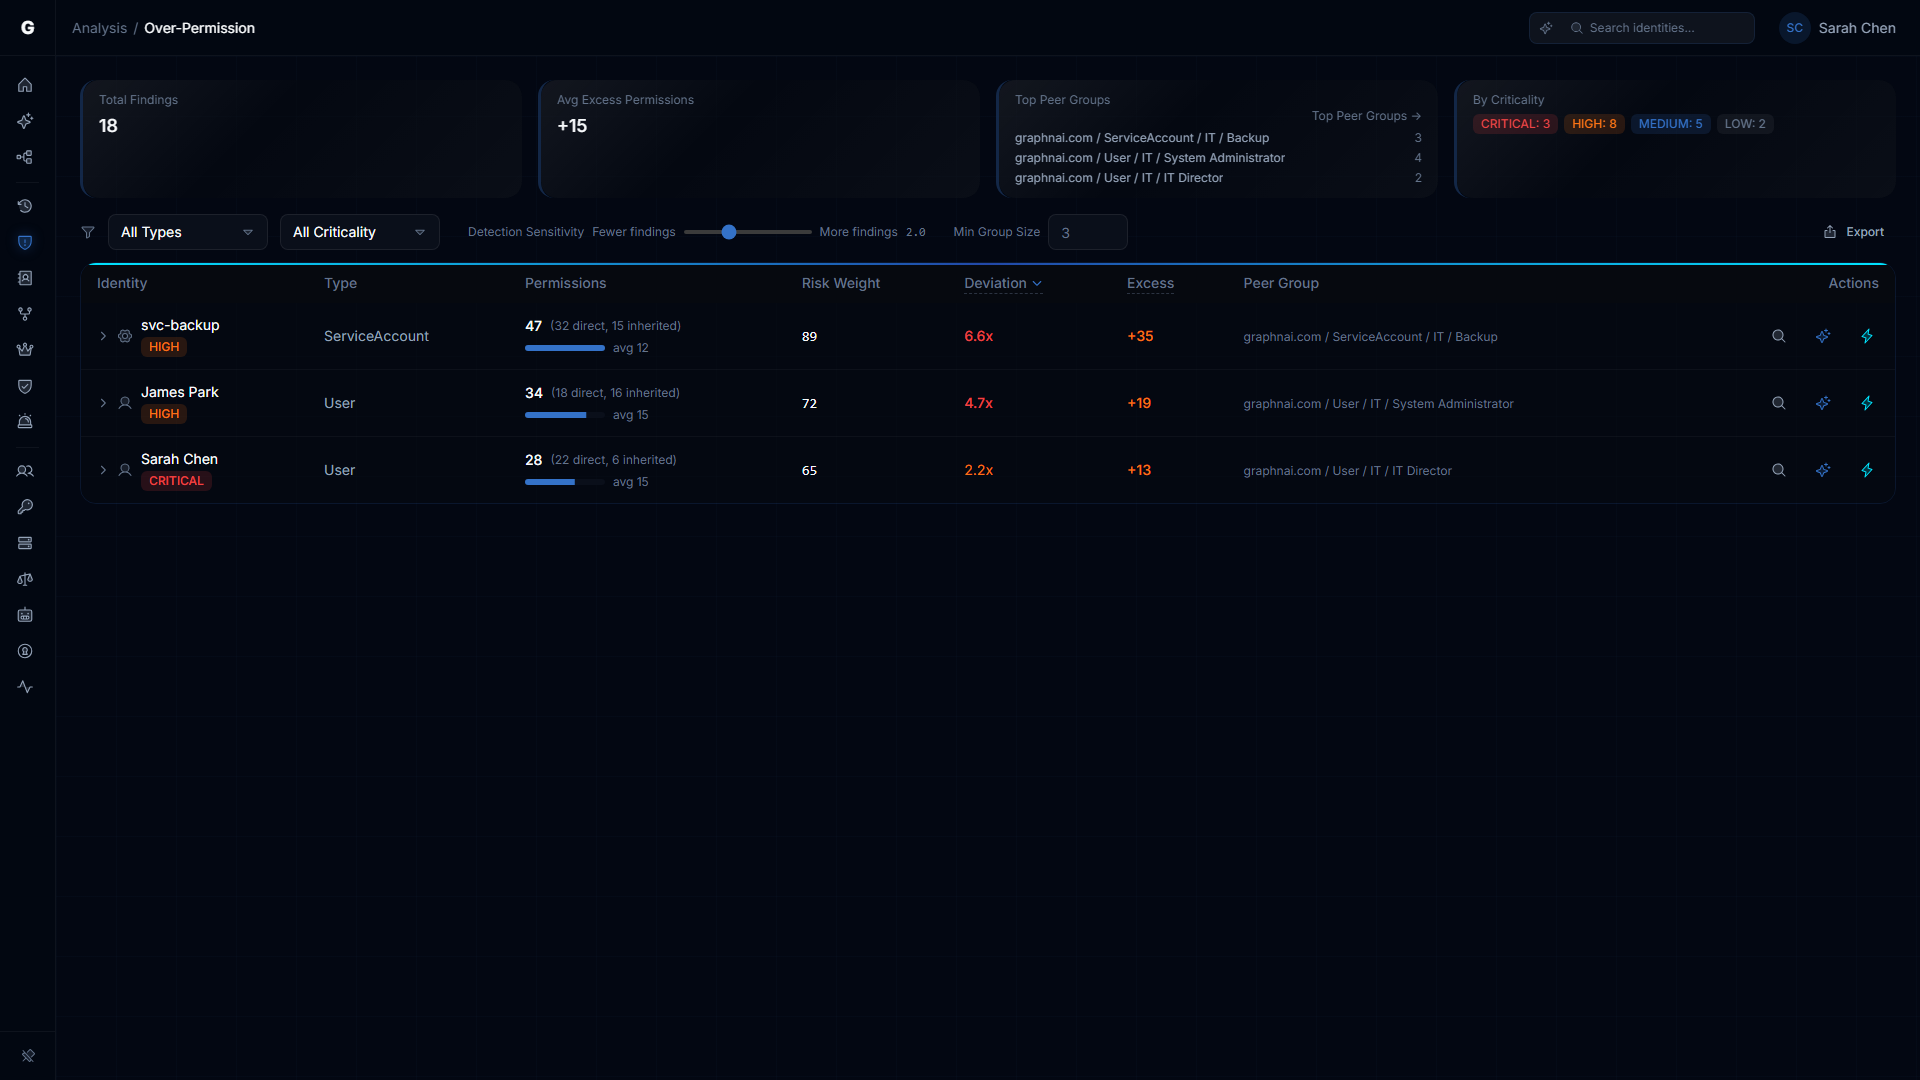
At the top of the page, four summary cards provide an at-a-glance overview:
Total Findings
The number of identities flagged as over-permissioned at the current sensitivity level.
Avg Excess Permissions
The average number of permissions above the peer baseline across all flagged identities. A value of +18.5 means flagged identities have, on average, 18.5 more effective permissions than their peers.
Top Affected Groups
The peer groups with the highest concentration of findings. Each entry shows:
- Peer group name (e.g., "User / IT / Helpdesk Technician")
- Finding count / total group size (e.g., "5 / 12")
If the same group appears repeatedly, it may indicate a systemic access hygiene issue in that department or role.
Filtering and Tuning
Detection Sensitivity Slider
Adjust how aggressively the system flags identities:
- More findings (left) — Lower threshold, catches more identities including borderline cases
- Fewer findings (right) — Higher threshold, only catches extreme deviations
The current sensitivity level is displayed as a label (Very High, High, Moderate, Low, Very Low). Changes to the slider are debounced — the query reruns 500ms after you stop moving it.
Identity Type Filter
Restrict analysis to a specific identity type:
- User — Standard human accounts
- Group — Security and distribution groups
- Computer — Machine accounts
- ServiceAccount — On-premises service accounts
- ServicePrincipal — Entra ID application identities
Leave set to All Types to analyze all identity types together. Each type is compared within its own peer groups, so Users are never compared against Computers.
Min Peer Group Size
Minimum number of members required for a peer group to be included in analysis. Default is 3.
- Increase to 5-10 if you want to exclude small teams where high variation is normal
- Decrease to 2 if you have a small organization and want to analyze all peer groups
Reading the Results Table
Each row represents a single over-permissioned identity. Columns include:
| Column | Description |
|---|---|
| Identity | Clickable name — click to focus the identity in the graph view |
| Type | Identity type (User, Group, Computer, ServiceAccount, ServicePrincipal) |
| Criticality | Criticality level (LOW, MEDIUM, HIGH, CRITICAL) |
| Permissions | Total effective permission count (direct + inherited) |
| Risk Weight | Severity-weighted permission score (higher = more dangerous permission mix). Accounts for the consolidated edge weight of each permission type. |
| Peer Avg | Average permission count for the peer group |
| Deviation | How far above the peer average this identity is. Higher = more extreme. Includes a visual bar for quick comparison. |
| Peer Group | Type-aware peer group name and size (e.g., "Computer / Windows Server 2022 (DC) (8)"). Sortable. |
Results are sorted by deviation score (highest first), with a secondary sort by criticality to prioritize high-impact findings.
TIP
Click any column header to sort. Shift+click to add secondary sorts — numbers next to sort arrows show priority. For example, shift+click "Risk Weight" after sorting by "Deviation" to break ties by severity.
Expanding a Row for Details
Click any row to expand it and see:
Permission Breakdown Chart: A horizontal bar chart showing the identity's permission count for each relationship type (HasPermission, GenericAll, etc.). Each bar shows the identity's permission count for that relationship type (blue) alongside the peer group average for the same type (gray). This makes it easy to spot which specific permission types drive the over-permission finding.
Excess Permissions: The number of permissions above the peer baseline (calculated as Permission Count - ceil(Peer Average)).
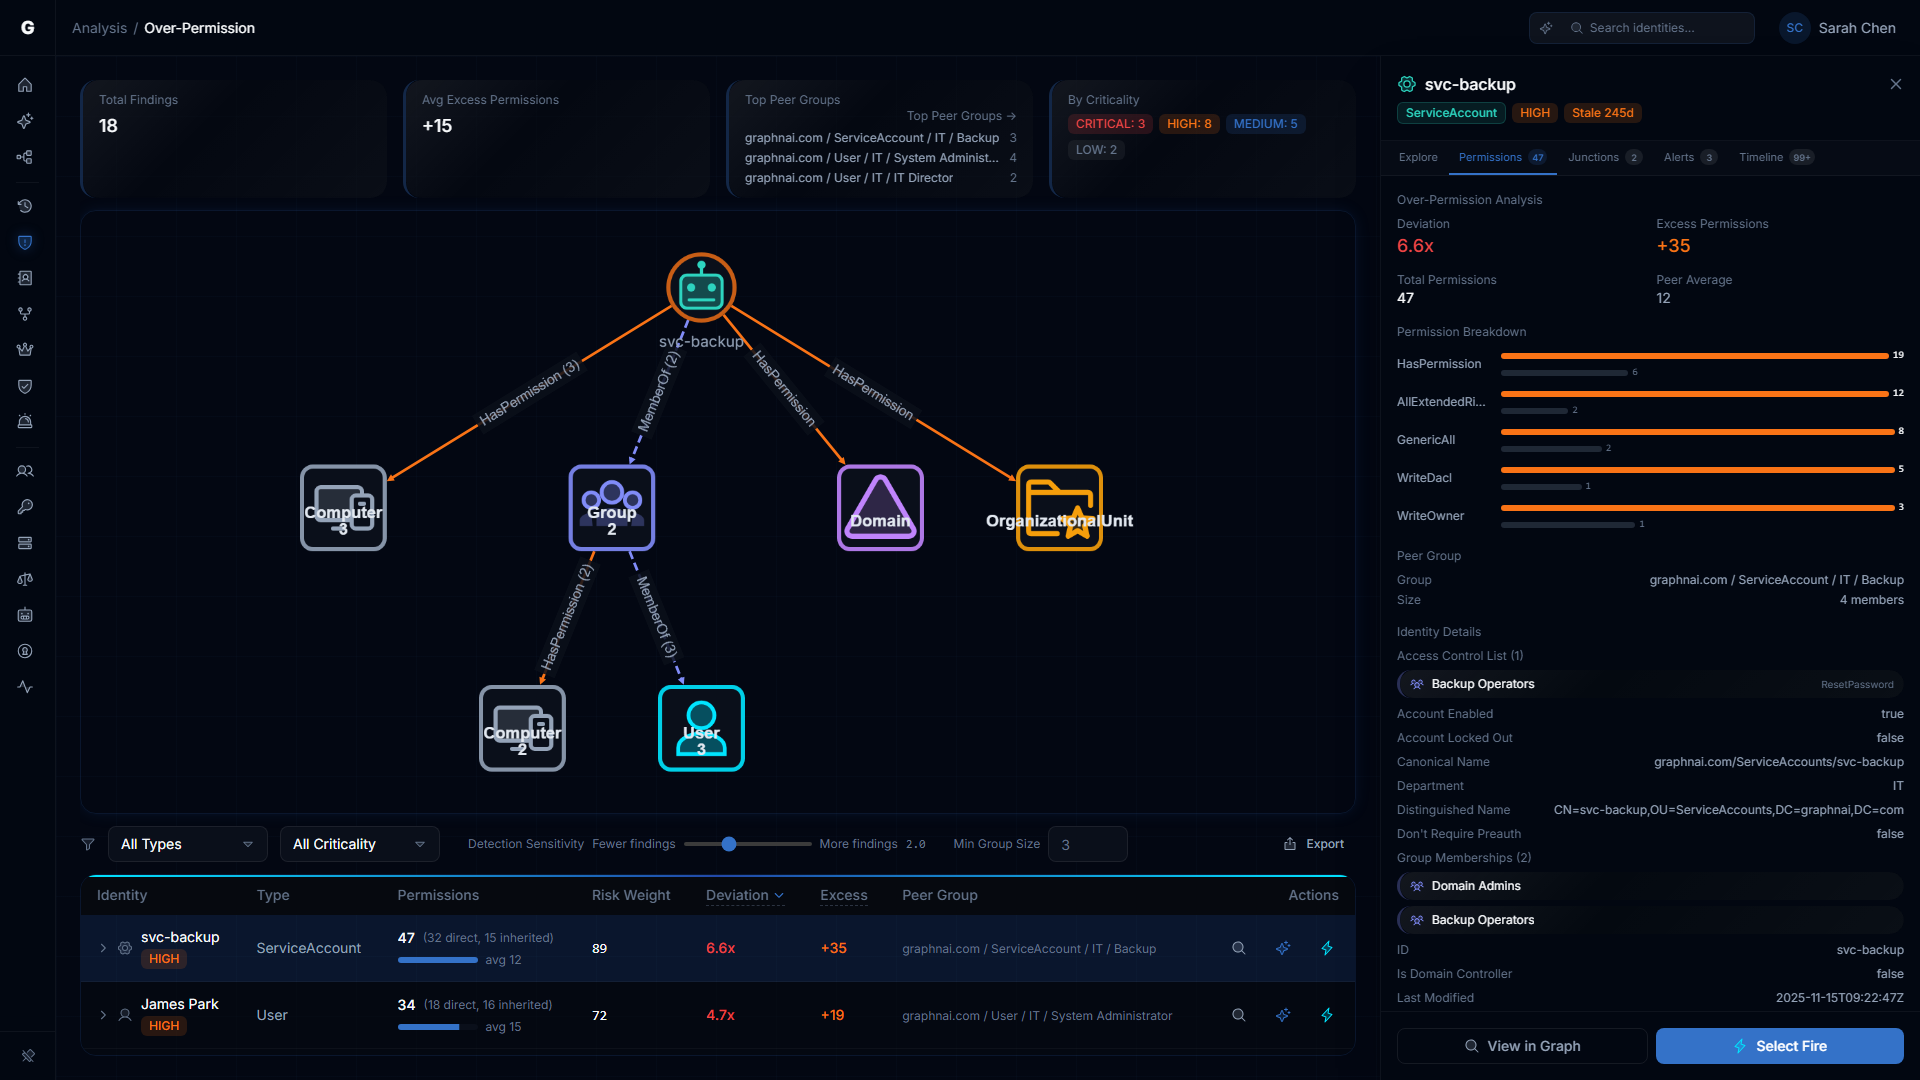
Direct / Inherited / Groups:
- Direct — Permissions assigned directly to this identity
- Inherited — Permissions inherited through group memberships
- Groups — Number of groups this identity belongs to (up to 5 levels of nesting)
High inherited permission counts often indicate group nesting issues worth investigating.
Peer Group Spread: How consistent the peer group's permissions are. A high spread means wide variation within the group; a low spread means the group is tightly controlled.
Tier: Asset criticality tier (if assigned by the criticality engine).
View in Graph Button: Navigates to the full graph view with the identity focused, allowing you to inspect the specific access paths and decide which permissions to revoke.
Example Use Cases
1. Quarterly Access Review
Scenario: You need to prepare a list of accounts for access review before an audit.
Steps:
- Set sensitivity to Moderate (default)
- Filter Type to User
- Review the top 20 findings
- For each finding, expand the row to check if inherited permissions are the primary driver
- For confirmed over-permissions, use the graph drill-down to identify which specific permissions to revoke
2. Service Account Audit
Scenario: Identify service accounts with excessive privilege that could be exploited if compromised.
Steps:
- Set sensitivity to High (more aggressive, since service accounts should be tightly scoped)
- Filter Type to ServiceAccount or ServicePrincipal
- Review findings sorted by deviation
- Expand each row to see which ACL permissions (GenericAll, WriteDacl) are excessive
- Work with app owners to reduce permissions to least-privilege
3. Nested Group Misconfiguration Detection
Scenario: Detect unintended group nesting that grants excessive inherited permissions (e.g., "Domain Computers" added to "Domain Admins").
Steps:
- Set sensitivity to Moderate
- Filter Type to Computer to see machines with unexpected admin access
- Look for findings with high Inherited counts — these indicate permissions via group nesting
- Expand rows and check the permission breakdown for admin-level access types (GenericAll, WriteDacl)
- Use the graph view to trace the MemberOf chain and identify the misconfigured group nesting
4. Insider Threat Monitoring
Scenario: Identify high-access users in sensitive departments for heightened monitoring.
Steps:
- Set sensitivity to Low (focus on significant deviations only)
- No type filter (include all identities)
- Look for findings in Finance, Legal, or HR peer groups
- Cross-reference with the Criticality column — HIGH or CRITICAL findings are highest risk
- Flag for additional logging, MFA enforcement, or periodic re-certification
5. Debugging "Unknown" Accounts
Scenario: You see many findings in "Unknown" peer groups.
Steps:
- Expand rows in that group to see which identities are missing directory attributes
- Investigate whether these are:
- Orphaned accounts — Former employees or decommissioned services
- Misconfigured accounts — Missing department/title in Active Directory
- External identities — Guest accounts or service principals without organizational metadata
- Either populate the missing attributes in your directory or exclude these identities from analysis using the Type filter
Interpreting Peer Group Baselines
High-Variation Groups
If a peer group has a high spread (e.g., peer average of 10 with spread of 8), it indicates inconsistent access within that role. This could mean:
- Poorly defined role — The job title doesn't correspond to a consistent set of responsibilities
- Multiple seniority levels — Mixing junior and senior staff in the same title
- Legacy access — Some members retained old permissions after role changes
Consider splitting the group by additional attributes (e.g., manager, cost center) or reviewing whether the department/title taxonomy needs refinement.
Zero-Variation Groups
If all members of a peer group have identical permission counts, the spread is zero and no findings will be flagged. This is normal for:
- Service account groups — Service accounts in the same role often have identical access by design
- New hires — Recent batch hires with identical onboarding templates
- Tightly controlled groups — Compliance-managed roles with strict access templates
Peer Group Explorer
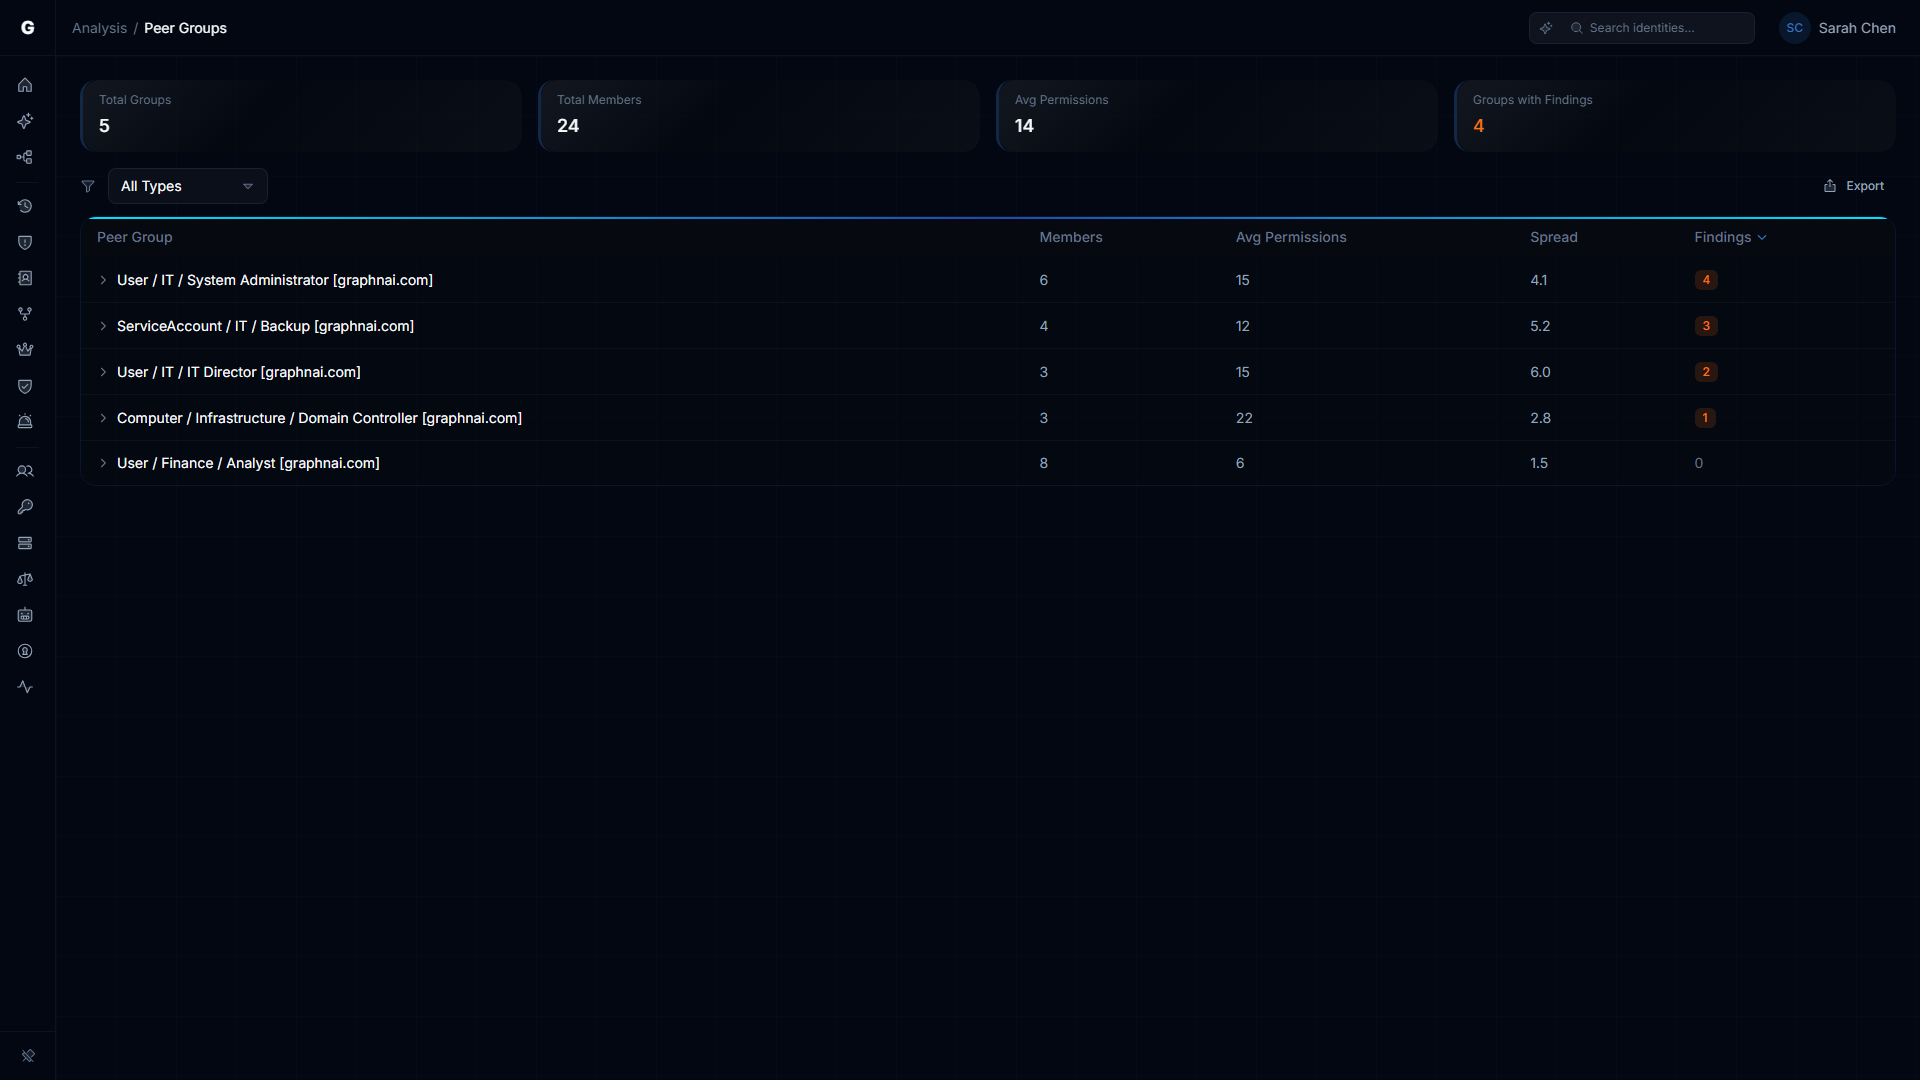
The Peer Group Explorer page (Analysis > Peer Groups in the sidebar) provides a comprehensive view of all peer groups in your environment.
Accessing the Explorer
- Navigate to Analysis > Peer Groups in the sidebar
- Or click the Top Peer Groups --> link on the Over-Permission page
What You'll See
Each peer group shows:
- Name — The type-aware peer group name (e.g., "Computer / Windows Server 2022 (DC)")
- Members — Number of identities in the group
- Avg Permissions — Average effective permission count
- Spread — How much variation exists within the group
- Findings — Number of over-permissioned identities detected
Click any row to expand and see the top outliers — the most over-permissioned identities in that group.
Use Cases
- Identify problematic peer groups — Groups with many findings may indicate systemic access issues
- Validate grouping quality — Check that peer groups reflect meaningful organizational boundaries
- Monitor group health — Groups with very high spread may need splitting or access standardization
Configuration Options
All analysis parameters are controlled via the UI filter bar. There are no persistent configuration files or settings — each query is stateless.
Troubleshooting
No findings detected at any sensitivity level
Cause: Your organization may have highly uniform access patterns, or directory attributes (department/title) are missing for most identities.
Resolution:
- Check that at least 50% of identities have populated
departmentandtitleattributes in your directory - Run a test sync to ensure these attributes are being ingested
- Try lowering the minimum peer group size to 2 to include smaller peer groups
Too many findings (100+ at moderate sensitivity)
Cause: Wide variation in access patterns, or peer groups are too coarse-grained.
Resolution:
- Move the sensitivity slider toward "Fewer findings" to focus on only the most extreme cases
- Increase the minimum peer group size to 5 or 10 to exclude small, high-variance groups
- Consider refining department/title taxonomy in your directory for more precise peer grouping
"Unknown" group dominates results
Cause: Many identities are missing department and/or title attributes.
Resolution:
- Populate missing attributes in Active Directory or Entra ID
- Use the Type filter to exclude orphaned or external identities if they skew results
- For service accounts without organizational metadata, filter to ServiceAccount type and analyze separately
Query timeout or slow response
Cause: Custom filter parameters trigger a live query instead of reading from the pre-computed cache.
Resolution:
- Use default settings (no custom filters) to load from the pre-computed cache instantly
- Apply a Domain filter — this serves from the per-domain cache directly
- If custom filters are needed, apply a Type filter to reduce the search space
- Check the Sync Metrics panel for the "Analytics" phase duration — this shows how long pre-computation takes per domain
Deviation score shows as 0.0 for some identities
Cause: The peer group has zero variation (all members have identical permission counts).
Resolution: This is expected behavior. No findings will be flagged from that peer group because there is no baseline variation. This typically occurs in:
- Service account templates
- New hire batches
- Highly controlled compliance roles
Best Practices
- Run quarterly access reviews — Use moderate sensitivity to identify access creep before audits
- Combine with criticality filtering — Focus on HIGH/CRITICAL identities first to prioritize remediation
- Check inherited permissions — High inherited counts often reveal group nesting issues worth fixing at the source
- Use peer group insights — If a peer group has many findings, investigate whether the baseline (not just the findings) is too permissive
- Track trends over time — Rerun the analysis monthly to track whether access hygiene is improving or degrading
- Integrate with access reviews — Export findings to your IAM ticketing system or send to department managers for attestation
- Don't ignore "Unknown" groups — Identities without directory metadata may be orphaned accounts or misconfigurations worth investigating
Limitations
- Attribute quality dependency: The analysis is only as good as your directory hygiene. Organizations with poor department/title data will have less meaningful peer groups.
- Edge severity weighting: Permission severity weighting is applied to the Risk Weight score. A
GenericAllpermission contributes more risk than aReadPropertypermission. The Permissions column shows unweighted counts for transparency. - Point-in-time analysis: Results reflect the graph state as of the last sync. There is no historical tracking of when identities became over-permissioned (this is a planned feature).
- Domain-scoped peer groups: Peer groups are scoped by domain. Identities in separate AD forests or disconnected Entra tenants are never compared. Cross-forest peer comparison (via trust relationships) is planned for a future release.
- Group nesting depth limit: Inherited permissions are traced up to 5 levels of group nesting. This exceeds any realistic AD environment but is not truly unbounded.
Related Features
- Stale Identity Detection — Identifies unused accounts that should be disabled
- Critical Junction Analysis — Finds high-risk compromise paths in the graph
- Asset Criticality Engine — Assigns criticality tiers to prioritize over-permission findings
- Change Simulation — Test the impact of revoking excessive permissions before making changes
Support
If you encounter issues with Over-Permission Analytics or have questions about interpreting results, contact your GraphnAI support team or consult the platform documentation at docs.graphnai.com.