Identity Graph — Data Model and Change Simulation
Understand how FidelID™ organizes your identities, resources, and relationships as a graph, and how to run "what-if" access simulations without affecting live data.
Requires role: Viewer (read-only graph exploration); Operator (change simulation)
Related: Risk Posture Dashboard | Stale Identity Detection | Over-Permission Analytics | Graph Explorer | Select Fire
Overview
FidelID™ models your entire identity environment — users, groups, computers, cloud applications, service accounts, and every permission connecting them — as a directed graph. Each identity or resource becomes a node; every permission, membership, or delegation becomes a labeled edge pointing from one node to another.
This graph is the foundation of every analysis in the platform. Stale identity detection, over-permission analytics, critical junction scoring, and AI-assisted remediation all work by traversing the graph and evaluating the connections it contains.
Understanding the graph model helps you interpret what you see in the Graph Explorer, construct meaningful search queries, and design change simulations that accurately reflect the access changes you want to evaluate.
Prerequisites
- At least one identity sync must have completed (from an LDAP bridge or Entra ID provider) to populate the graph with data
- Viewer role is sufficient to explore the graph and run searches
- Operator or Admin role is required to create change simulations
How the Graph Is Organized
The graph is divided into three types of data:
| Category | What It Contains | Examples |
|---|---|---|
| Identities | The actors — who can do things | Users, Groups, Computers, Service Accounts, Service Principals, Roles, Organizational Units, Domains |
| Resources | The targets — what can be accessed | Applications, Databases |
| Policies | The rules that govern access | Group Policy Objects (GPOs) |
Connections between these are stored as relationships (edges). Every relationship has a direction — it points from one node to another — and carries a label indicating what type of access or membership it represents.
Identity Types
When you open the Graph Explorer or receive search results, every node has a Type field. The types available in the platform are:
| Type | Description |
|---|---|
| User | Human user accounts (employee or contractor accounts) |
| Group | Security or distribution groups that bundle permissions for their members |
| Computer | Domain-joined workstations and servers |
| ServiceAccount | Accounts used by applications or automated processes |
| ServicePrincipal | Cloud service identities (Entra ID app registrations, managed identities) |
| Application | Applications registered in cloud directories |
| Device | Mobile devices, IoT endpoints |
| Role | Directory roles (e.g., Global Administrator, Intune Administrator) |
| Tenant | The root Entra ID tenant object |
| OrganizationalUnit | Active Directory organizational unit containers |
| Container | Generic AD container objects |
| BuiltinDomain | The Built-in domain object in Active Directory |
| Domain | An Active Directory domain |
To search for a specific identity by name or type, use the search bar at the top of the Graph Explorer. Partial name matches are supported (minimum 2 characters).
Relationship Types
Every edge in the graph has a type that describes the nature of the access or structural connection. Relationships fall into three categories:
Structural Relationships
These describe how identities are organized and how permissions are inherited.
| Relationship | Meaning |
|---|---|
| MemberOf | Identity A is a member of Group B — inherits the group's permissions |
| HasPermission | Identity A has a directly assigned permission on a target |
| ContainedIn | Object A lives inside container B (OU or domain hierarchy) |
| OwnerOf | Identity A is the owner of object B |
| HasRole | Identity A holds directory Role B |
| AppRoleAssignment | Identity A has been assigned an application role |
Architecture Relationships
These describe trust and delegation at an infrastructure level.
| Relationship | Meaning |
|---|---|
| GPLink | A Group Policy Object is linked to an OU or domain |
| TrustedBy | Domain A is trusted by Domain B |
| AllowedToDelegate | Identity A is permitted to delegate authentication on behalf of others |
Permission (ACL) Relationships
These represent specific Active Directory permission grants — read from the access control lists of objects during sync. They indicate precise control one identity has over another.
| Relationship | Meaning |
|---|---|
| GenericAll | Full control over the target object |
| GenericWrite | Ability to write any property on the target |
| WriteDacl | Can modify the permissions list of the target |
| WriteOwner | Can take ownership of the target |
| AllExtendedRights | All extended Active Directory rights (includes password replication, etc.) |
| ForceChangePassword | Can reset the target user's password without knowing the current one |
| AddMember | Can add members to the target group |
ACL relationships are particularly important for attack path analysis. A chain of
MemberOfandWriteDacledges can represent a complete path from a low-privilege user to administrative access.
Fidelity Tiers
Every relationship in the graph carries a fidelity tier that tells you how confident the platform is that the access is real and currently active. This is the Tiered Fidelity™ model.
| Tier | Label | What It Means |
|---|---|---|
| Tier 1 | Theoretical | The access is configured (e.g., the user is a member of the group in Active Directory). It may or may not be used. |
| Tier 2 | Constrained | The access is additionally consistent with firewall rules, policies, or other constraints. The path is plausible, not just possible. |
| Tier 3 | Validated | The access has been confirmed by observed telemetry — a real authentication or activity event was recorded. |
Higher fidelity means higher confidence. When analyzing attack paths or over-permissions, prioritize Tier 3 findings (confirmed active access) over Tier 1 findings (configured but potentially dormant).
In the Graph Explorer, relationships are shown with their fidelity tier in the edge details panel. The overview mode prioritizes higher-fidelity edges when the graph is large.
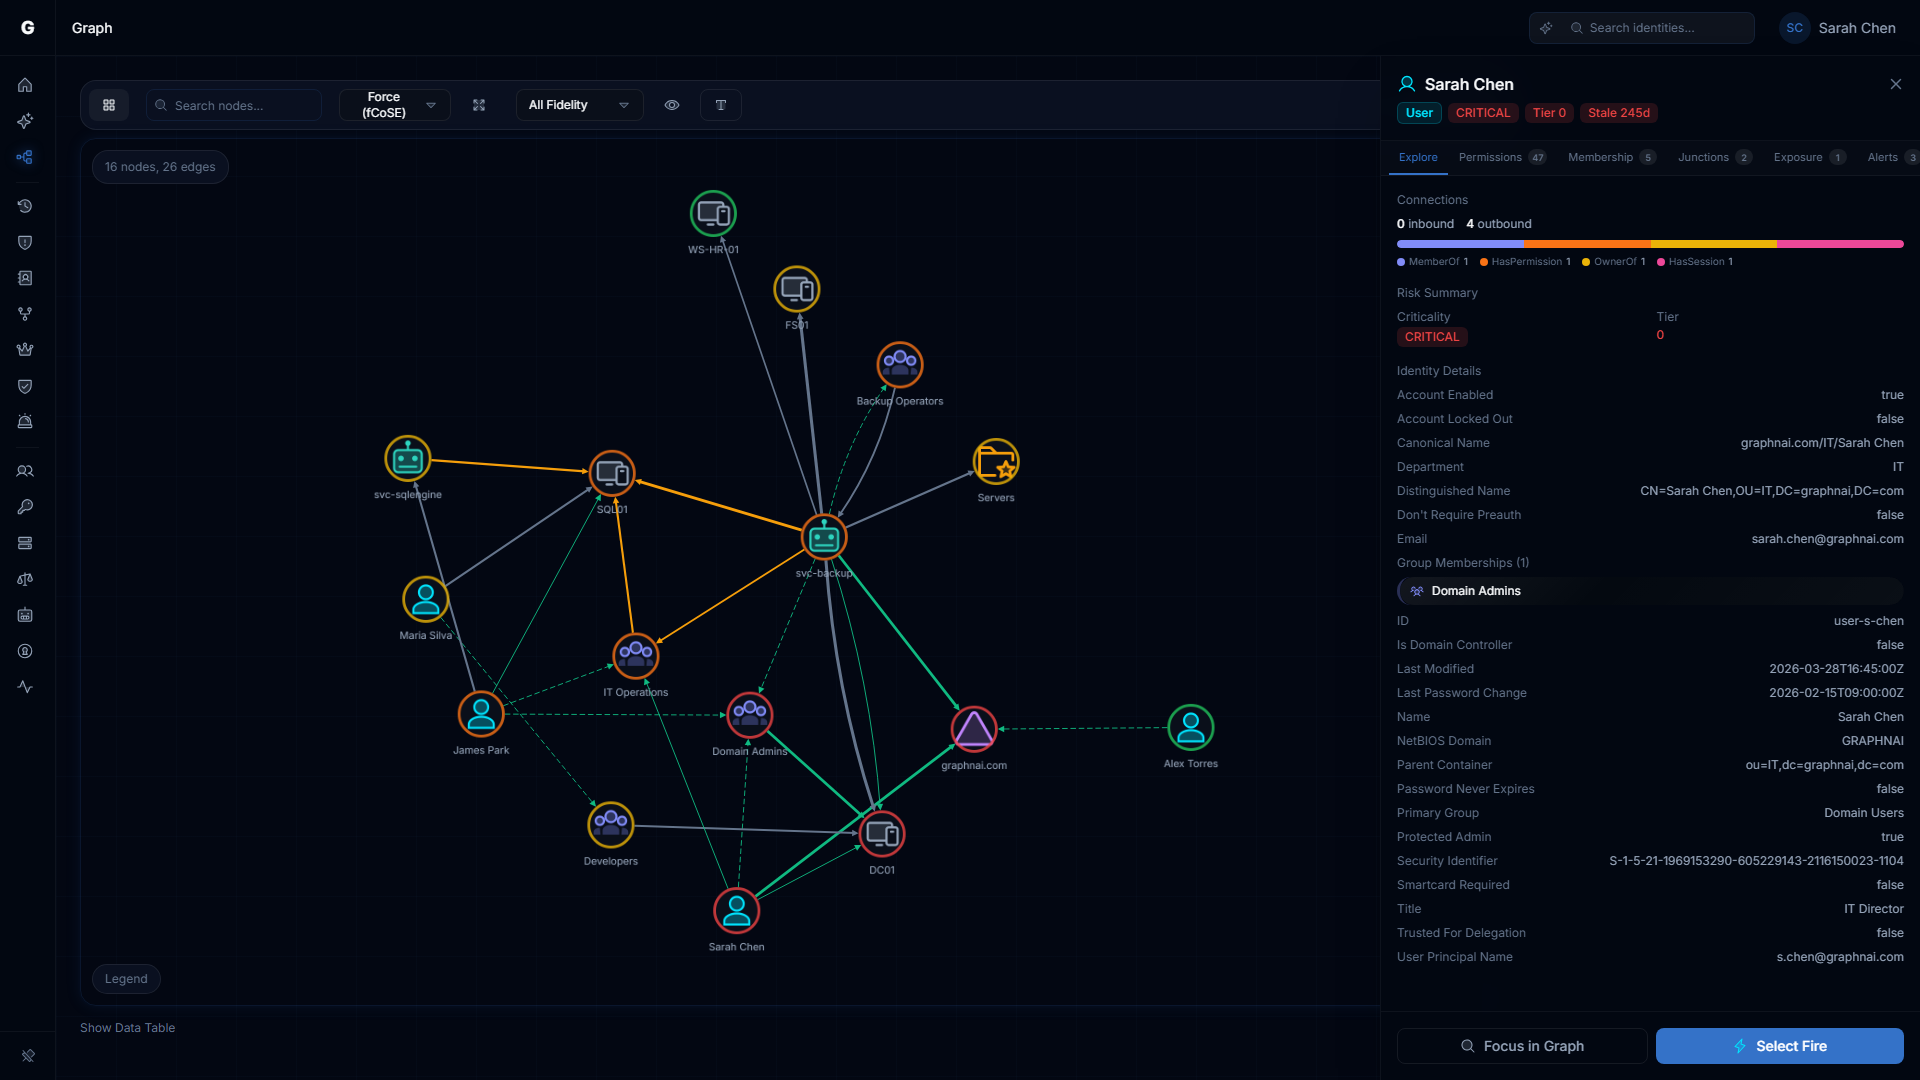
Criticality and Tier Assignment
Identity nodes in the graph carry additional fields written by the platform's Asset Criticality Engine:
| Field | Values | Meaning |
|---|---|---|
| Criticality | LOW, MEDIUM, HIGH, CRITICAL | Risk level assigned based on the identity's access scope, group memberships, and administrative flags |
| Tier | 0, 1, 2 | Privilege tier. Tier 0 = highest privilege (domain controllers, domain admins, enterprise admins). Tier 2 = standard users. |
| IsCritical | true / false | Quick flag — true if this identity is considered a high-value target |
| IsJunction | true / false | Marks identities that act as bridges between low-privilege and high-privilege zones (computed by the Junction Engine) |
| JunctionScore | 0.0 — 1.0 | How frequently this identity appears on attack paths between privilege zones |
These fields are updated automatically after each sync cycle. You do not need to configure them manually.
Viewing the Graph
Graph Explorer — Overview Mode
When you open the Graph Explorer without selecting a specific identity, the platform shows an overview of the graph. In overview mode:
- Up to 500 relationships are displayed, prioritized by fidelity tier (Tier 3 first) and recency
- The layout gives you a bird's-eye view of the dominant connections in your environment
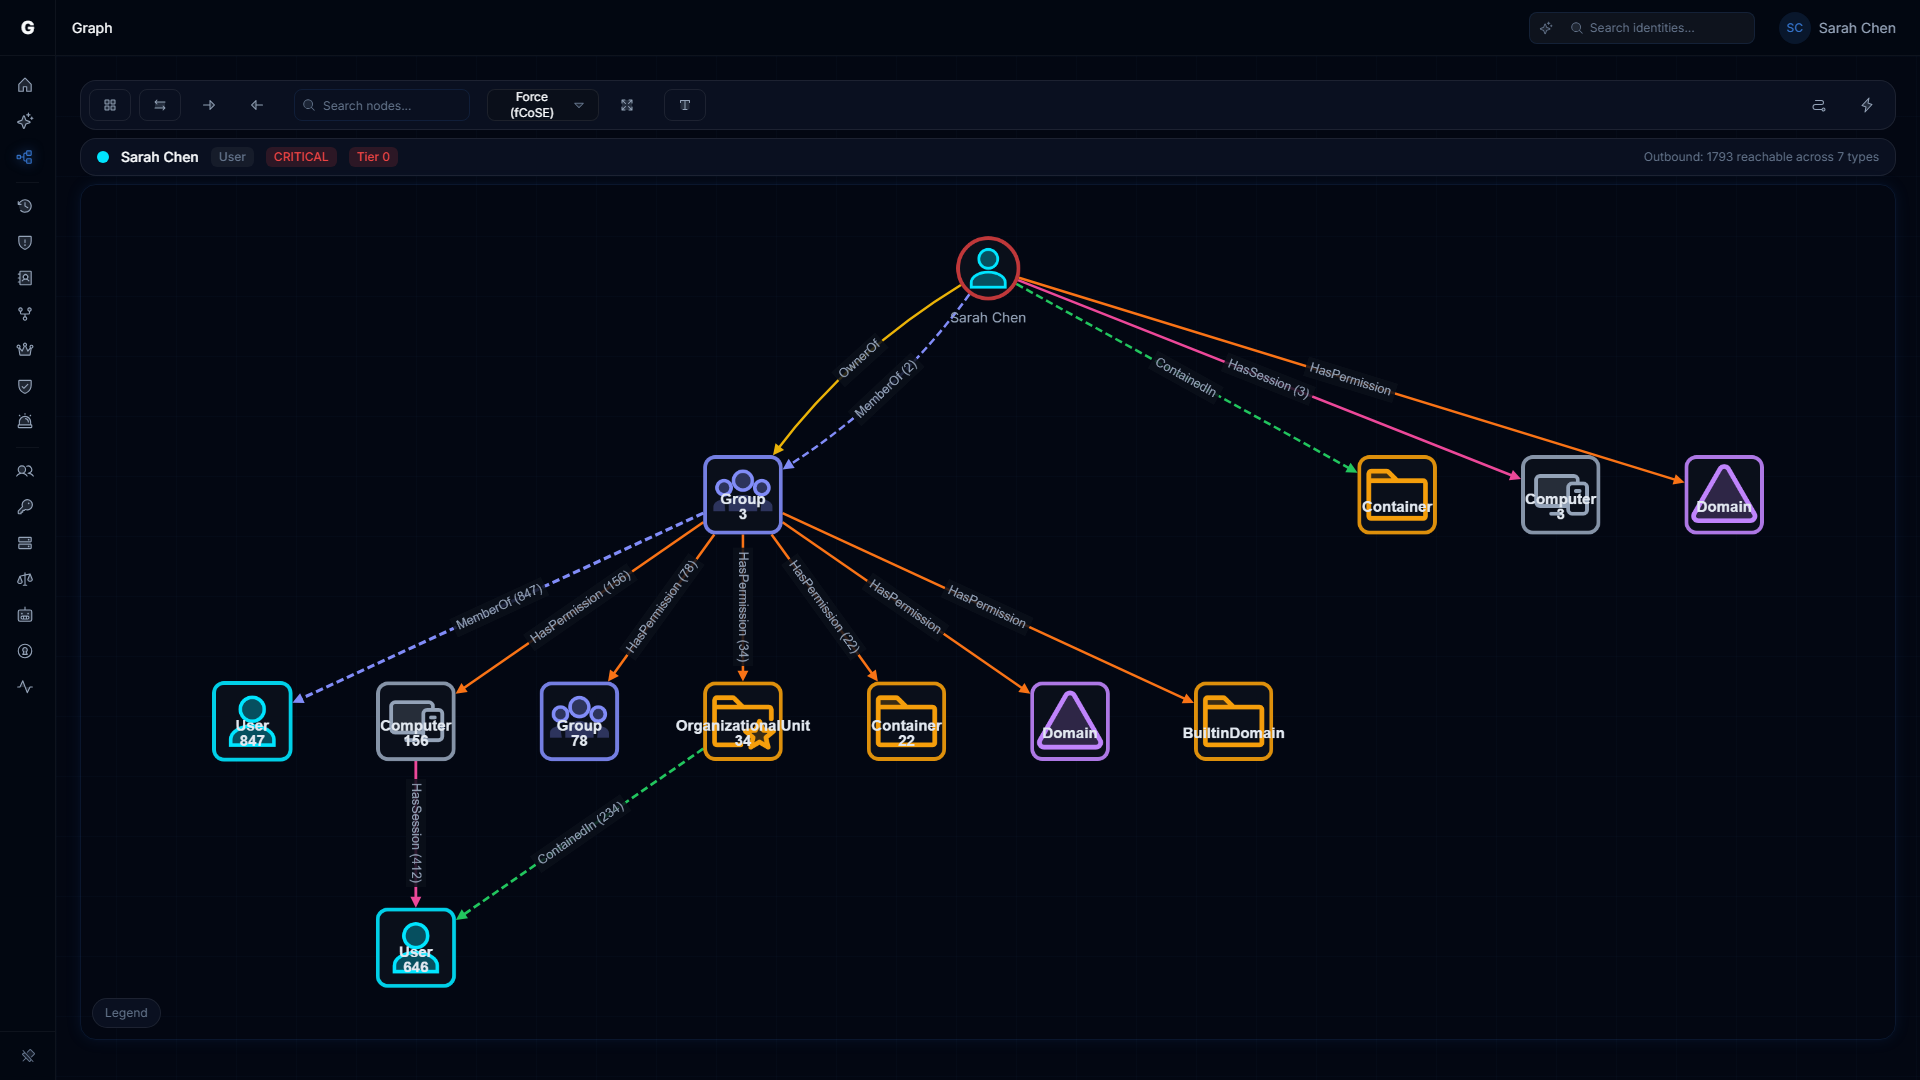
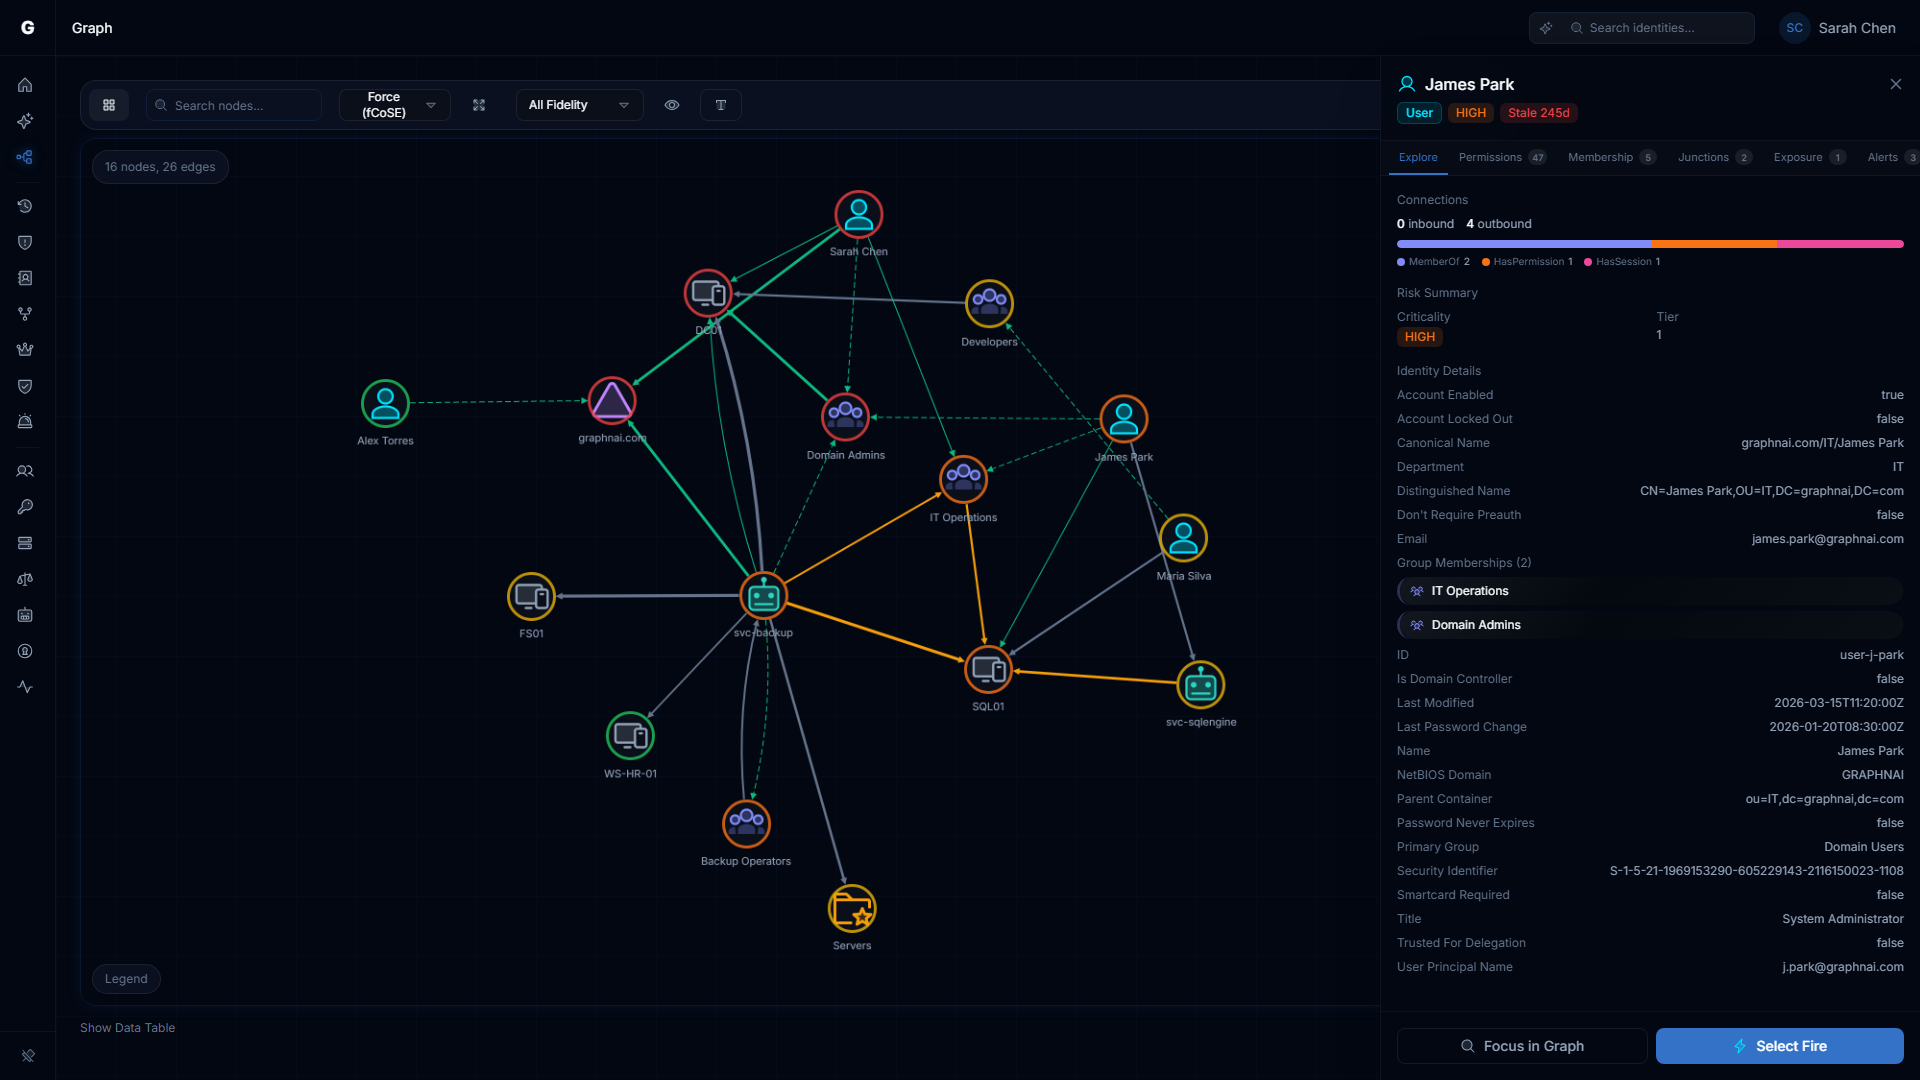
Graph Explorer — Focused Mode
To investigate a specific identity, search for it by name or select it in the graph. Focused mode shows:
- All structural relationships to and from that identity (group memberships, containment, role assignments) — no limit
- Up to 100 inbound and 100 outbound ACL relationships (sorted by fidelity, highest first)
- The identity's criticality, tier, and junction status in the details panel
Searching for Identities
The search bar at the top of the Graph Explorer accepts partial name matches and returns results from both identity and resource collections.
To search:
- Type at least 2 characters into the search bar
- Results appear showing the identity name, type, and criticality level
- Click a result to focus the graph on that node
Search matches on display names (e.g., john.doe) and, for Active Directory accounts, on the login name (sAMAccountName). When multiple identities share a similar name, the platform selects the one with the most connections as the best match.
Change Simulation (Differential State Engine™)
The Differential State Engine™ lets you model access changes — adding or removing permissions — and immediately see the impact on the graph, without touching your production environment or live data.
Simulations are entirely temporary. They expire automatically after one hour (configurable by your administrator) and can be cancelled at any time.
What You Can Simulate
- Remove access: See what happens to an identity's reach if a permission or group membership is revoked
- Add access: See what new paths would open if an identity were granted a permission
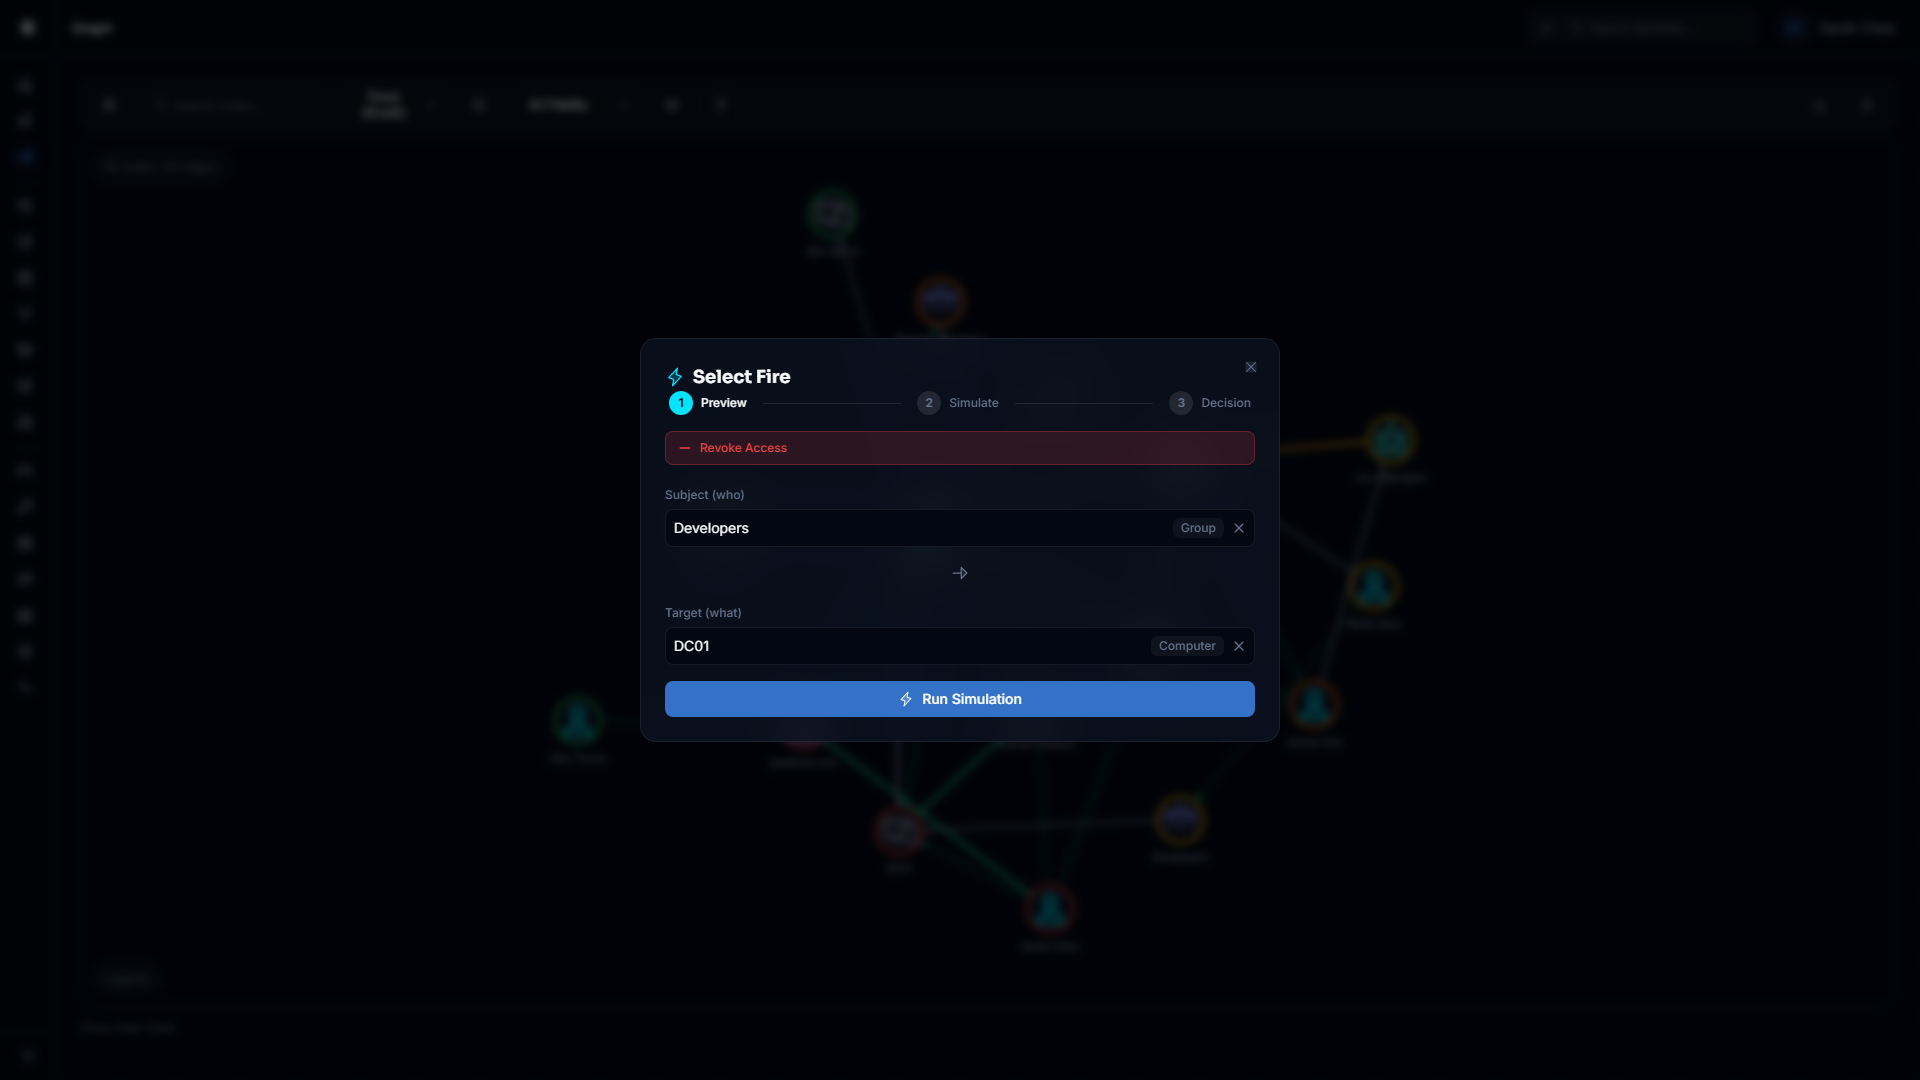
Running a Simulation
To run a change simulation:
- Navigate to the Graph Explorer and click the Lightning button in the toolbar to open Select Fire (or right-click a node and choose Select Fire)
- Search for the subject and target identities
- Click Run Simulation
- The platform computes the blast radius and displays the impact — affected nodes, the Operational Safety Metric, and remediation options
For full details on the Select Fire workflow, see the Select Fire guide.
Simulation Limits
- Simulations expire automatically after 1 hour (default). Your administrator can adjust the simulation expiry time via server configuration.
- Rate limit: 10 simulation requests per minute per IP address
- Simulations are read-only from the perspective of your production data. They never write to Active Directory, Entra ID, or any source system.
Understanding What the Graph Shows
Why some edges are missing
The graph explorer applies limits to keep rendering fast:
- In overview mode: Up to 500 edges are shown, sorted by fidelity (Tier 3 first) and recency
- In focused mode: ACL relationships (GenericAll, WriteDacl, etc.) are capped at 100 inbound and 100 outbound per node; structural relationships (MemberOf, ContainedIn, etc.) are shown without a count limit
If you expect to see a specific edge between two nodes, search for one of them and use focused mode. Focused mode will include all structural edges for that node.
Why the graph may not reflect very recent changes
The graph reflects the most recent completed sync from your configured bridges and Entra ID providers. If a change was made in Active Directory or Entra ID after the last sync, it will not appear in the graph until the next sync runs.
To trigger a manual sync, navigate to Bridges in the sidebar and click Trigger Sync on the relevant bridge.
Why an identity appears with no edges
An identity node may exist in the graph without visible edges if:
- All of its relationships were pruned as stale during the last sync (the identity was removed from all groups)
- Its relationships are exclusively ACL-type and the per-node ACL limit was reached by higher-fidelity edges
- The identity belongs to a domain that is synced by a different bridge not connected to this server
Troubleshooting
Search returns no results
Possible causes:
- The search query is fewer than 2 characters — extend the search term
- The identity name does not match exactly: try using a login name (e.g.,
jdoe) instead of a display name (e.g.,John Doe) - No sync has completed yet — the graph is empty
Solution: Confirm a sync has completed by checking the Bridge detail page Sync History section.
Graph Explorer shows "Failed to load topology"
Possible causes:
- Database connectivity — The server lost connection to the database
- No data — The graph is empty because no sync has run
- Session expired — Your login token has expired
Solution: Refresh the page. If the error persists, check the platform's health status. A response other than 200 OK indicates a backend issue.
Simulation request returns 400 Bad Request
Cause: The subject or target identity could not be found in the graph.
Solution:
- Use the search bar in Graph Explorer to verify the identity exists
- Confirm the identity's exact display name or login name from the search result
- Resubmit the simulation request with the confirmed name
Simulation returns but the graph looks unchanged
Cause: The simulated edge was already absent from the graph (the relationship did not exist to begin with), so removing it has no visible effect.
Solution:
- Use the Graph Explorer in focused mode to confirm the relationship exists before simulating its removal
- Confirm that you are viewing the simulation results and not the live graph
Fidelity tier is always Tier 1 — no Tier 3 data
Cause: Tier 3 (Validated) relationships require telemetry data from authentication events. If no telemetry source is configured, all relationships will remain at Tier 1 (Theoretical) or Tier 2 (Constrained).
Solution: Contact your administrator about configuring a telemetry ingestion source to enable Validated-tier evidence.
Best Practices
- Use focused mode for investigation — Overview mode is a broad survey; focused mode gives the complete picture for a specific identity
- Check fidelity before acting — Tier 1 findings may be outdated or dormant. Prioritize Tier 3 (Validated) and Tier 2 (Constrained) when deciding on remediation
- Run simulations before revoking access — Use change simulation to confirm you understand the blast radius of an access change before implementing it in your directory
- Search by login name for precision — Common display names may match multiple identities. Using the AD login name (
sAMAccountName) or Entra ID user principal name gives a more precise result - Focus on Tier 0 and junction nodes — Nodes with
tier: 0orisJunction: trueare your highest-value targets. Start every investigation by reviewing their inbound ACL relationships